January Short-Term Energy Outlook
Global Oil Markets
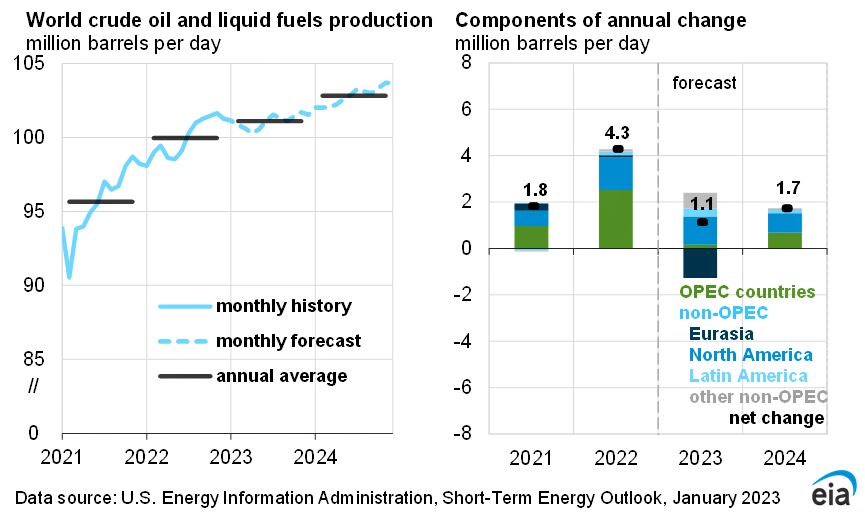
The U.S. Energy Information Administration ("EIA") forecasts world production of petroleum and other liquid fuels will increase by 1.1 million barrels per day (“b/d”) in 2023 and 1.7 million b/d in 2024. This increase reflects large growth in several non-OPEC countries and in OPEC output that more than offset 1.5 million b/d of declines in Russia’s production over the forecast period.
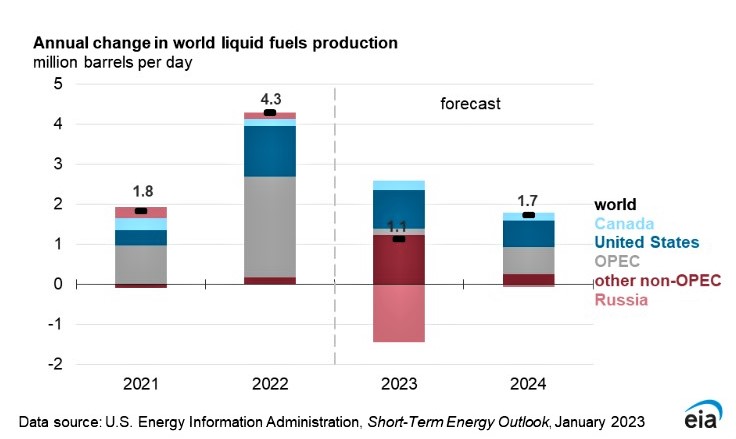
The forecast for the United States and other non-OPEC producers outside of Russia will add 2.4 million b/d of oil production in 2023 and an additional 1.1 million b/d in 2024. The largest source of non-OPEC production growth over the forecast period is the United States, which contributes 40% of growth in 2023 and 60% of growth in 2024. U.S. growth is driven by increases in crude oil production in the Lower48 states—mostly in the Permian region—as well as a combination of increases to production of hydrocarbon gas liquids and biofuels, which together account for about 40% of U.S. liquid fuels production growth in 2023 and 2024.
Outside of the United States, other major sources of growth in non-OPEC liquid fuels production come from Canada, Brazil, Guyana, and Norway. EIA expects that increases in Canada’s production will be driven by projects to improve distribution bottlenecks, including the start-up of the Trans Mountain pipeline expansion project. Brazil’s increases are driven by new floating production, storage, and offloading “(FPSO”) deepwater rigs.
A new source of world oil supply is Guyana, which first began producing oil in 2019 after the discovery of the new offshore deepwater Liza oil field. Critical investment and new production vessels helped Guyana’s oil production increase to an average of 260,000 b/d in 2022.EIA expects further ramp-ups in output and the development of new oil resources over the next two years, helping oil production in Guyana increase to an average of 540,000 b/d by 4Q24.
Growth in Norway’s oil output in 2023 stems from the recent start-up of the offshore Johan Sverdrup Phase 2 expansion project, which will result in Norway’s liquid fuels production rising by more than 500,000 b/d over the forecast to reach almost 2.5 million b/d in 2024.
EIA expects that these sources of growth in non-OPEC liquid fuels supply will offset declines in Russia‘s oil production. They forecast that Russia’s petroleum and other liquid fuels production will decline to 9.5 million b/d in 2023, from 10.9 million b/d in 2022, and then average 9.4 million b/d in 2024. The extent to which European Union sanctions, other sanctions, and the G7 price cap will affect Russia’s crude oil and petroleum product exports and production remains uncertain.
The expectations that most crude oil exports from Russia will continue to find buyers. The sanctions on petroleum products will cause greater disruptions to Russia’s oil production and exports because finding alternative buyers as well as transportation and other services to reach those buyers is likely to be more challenging than for crude oil.
OPEC crude oil production in EIA forecasts averages 29.5 million b/d in 2024, up 0.8 million b/d from 2022. Part of this growth is driven by Venezuela. Following the U.S. Department of the Treasury issuing General License (GL) 41 at the end of November, Chevron is resuming oil production in Venezuela for export to the United States. OPEC production forecast is subject to considerable uncertainty, driven by a combination of possible outcomes for country compliance to existing OPEC+ production targets and changes to existing OPEC+ targets, as well as ongoing developments in Iran, Libya, and Venezuela.
Global liquid fuels consumption. Forecast global consumption of liquid fuels reaches 102.2 million b/d in 2024, driven primarily by growth in non-OECD countries, such as India and China. Trends in oil consumption largely reflect trends in economic activity. EIA forecasts growth in global demand for oil will slow in 2023 before picking up in 2024, as global GDP growth (based on forecasts from Oxford Economics) rises from 1.8% in 2023 to 3.3% in 2024. Although they forecast global oil consumption to increase, the demand forecast remains uncertain as a result of ongoing concerns around global economic conditions and the impact of the easing COVID-19 restrictions and rising case counts in China.
Petroleum Products
Gasoline and diesel prices. Gasoline and diesel prices in the EIA forecasts generally decline as wholesale refining margins and crude oil prices fall. In December 2022, the U.S. retail price for regular grade gasoline averaged $3.21 per gallon (“gal”), and the retail diesel price averaged $4.71/gal. December prices were the lowest since the beginning of Russia’s full-scale invasion of Ukraine in February. In EIA’s forecast for 2023 and 2024, U.S. refinery runs, and gasoline and diesel production are higher than in 2022, which along with increasing global refinery capacity, will contribute to narrowing U.S. refining margins in 2023 and 2024.
IA forecasts retail gasoline prices will remain close to current levels and average about $3.30/gal in 2023. In 2024, retail gasoline forecast prices will average about $3.10/gal and fall below $3.00/gal by January 2023 the end of the year. The retail diesel forecast prices average about $4.20/gal in 2023 and near $3.70/gal in 2024. Diesel prices will remain higher than gasoline prices as the market continues to adjust to disruptions largely related to responses to Russia’s full-scale invasion of Ukraine. Russia had been a major supplier of diesel fuel to Europe, which is now importing more diesel from the Middle East and India.
Gasoline and distillate inventories. In 2022, both gasoline and distillate inventories in the United States were below their previous five-year (2017–2021) averages for the entire year because of reduced refinery capacity, less-than-average imports, and expanding exports. Higher refinery runs and less consumption contributed to distillate fuel inventories increasing during 4Q22 by more than the previous five-year average. EIA estimates that 5.1 million barrels per day of distillate was produced in the United States during 4Q22, up 5% from a year earlier, as refiners increased production in response to high crack spreads—the difference between the price at which refiners sell fuel and the price of crude oil.
EIA expects U.S. distillate inventories will increase in 2023 due to increasing refinery runs as refiners capitalize on high distillate crack spreads. Refiners have a limited ability to shift their product yields, so the expectation of gasoline production is to increase in 2023 alongside distillate production. As a result, the forecast gasoline inventories will rise above their previous five-year average from May 2023 through the end of the year. Although net U.S. exports of gasoline will increase in 2023, expectation of these volumes will come from increased gasoline production. EIA forecasts almost no change in U.S. gasoline consumption over the next two years. Their expectation of relatively flat gasoline consumption stems from increases in vehicle miles traveled being offset by increases in the fuel efficiency of the vehicle fleet.
Declining freight activity and declining manufacturing activity in distillate-intensive industries led to decreased U.S. distillate consumption at the end of 2022. The EIA’s 4Q22 estimate for U.S. distillate consumption of 3.9 million b/d was the lowest for a fourth quarter since 2015. In the forecast, U.S. distillate consumption declines slightly in 2023. However, distillate consumption will pick up in 2024 as the rate of economic growth increases.
Natural Gas
Natural gas prices. EIA expects the Henry Hub natural gas spot price to average near $5.00 per million British thermal units (“MMBtu”) in 1Q23. The Henry Hub price began January below $4.00/MMBtu as a result of warmer-than-normal temperatures across much of the country. However, prices are expected to rise back above $5.00/MMBtu in late-January and stay above that in February as temperatures in the forecast fall and liquefied natural gas (“LNG”) exports from Freeport LNG resume, increasing demand for natural gas.
Extreme weather events can cause price spikes and volatility at both the Henry Hub and in regional markets. Spot prices reached more than $50.00/MMBtu in some western markets in December, and potential natural gas supply constraints in New England could cause large price increases if extreme cold weather hits the region. Based on the most recent press release from Freeport LNG, the facility will resume partial operations in January, which will increase U.S. LNG exports and put upward pressure on prices. However, any additional delays to the restart of Freeport, which was originally scheduled to restart partial operations in November, will contribute to downward pressure on prices in the near term.
Once heating demand subsides this winter, the prices are expected to average near $5.00/MMBtu for the last three quarters of 2023. Increases in U.S. natural gas production, relatively flat LNG exports, and declining domestic consumption in the electric power and industrial sectors will limit upward pressure on prices in 2023.
Despite expectation that new LNG export facilities and expansion projects will come online in 2024, EIA expects natural gas prices to be relatively flat—with the possibility of lower prices—due to continued increases in U.S. natural gas production. EIA expects production in both the Permian region in West Texas and Southeast New Mexico and in the Haynesville region in Louisiana and East Texas to continue to grow with the completion of new pipeline infrastructure expansions in 2023 and 2024.
Natural gas consumption. During the winter months in the United States, the residential and commercial sectors are large drivers of natural gas consumption because natural gas is used for space heating in homes and commercial buildings and demand for heating rises as the weather gets colder. EIA expects natural gas consumption in the U.S. residential and commercial sectors to average about 46 billion cubic feet per day (“Bcf/d”) in January, which is slightly less than the five-year (2018–2022) average. Less-than-average January consumption reflects a relatively mild start to the month across much of the country that reduced space heating demand for natural gas. EIA expects U.S. residential and commercial natural gas consumption to average 43 Bcf/d in February, which is also less than the five-year average, as forecasts from the National Oceanic and Atmospheric Administration indicate above normal temperatures for February in the eastern part of the United States. Residential and commercial natural gas consumption can be highly variable in winter months due to extreme weather events, such as in February 2021 when extreme cold weather across much of the United States led to increased residential and commercial natural gas consumption.
Electricity and Renewables
Electricity consumption. EIA forecasts that total consumption of electricity in the United States will remain fairly stable, falling by 1% in 2023 and then growing by just over 1% in 2024. They estimate that electricity consumption grew by 3% in 2022.
Most expected change in U.S. electricity demand occurs in the residential sector, where expected retail sales will fall as a result of a milder summer in 2023 compared with 2022 with about 10% fewer cooling degree days. Residential electricity sales grow in 2024 because 5% more heating degree days are expected in 1Q24 compared with 1Q23. The forecast also reflects trends in the housing stock. The forecast assumes the U.S. housing starts resume growing in 2024 after a sharp decline in growth in 2023.
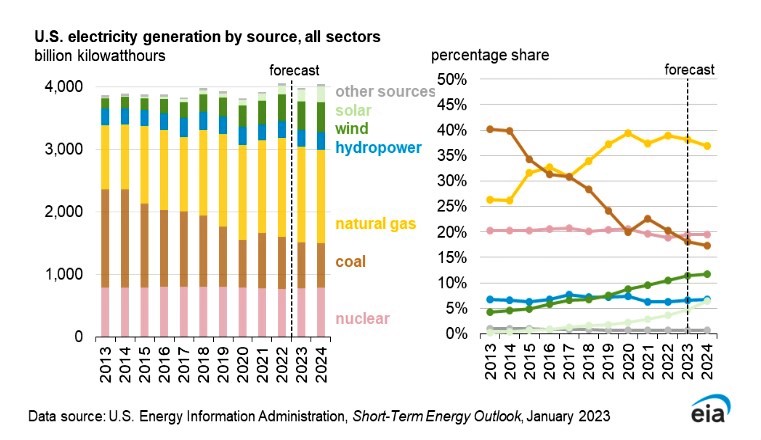
Electricity generation. U.S. generation in the EIA forecast largely follows consumption, declining in 2023 then rising in 2024. Generation from renewable sources is the main contributor of growth in U.S. electricity generation. The forecast share of U.S. renewables generation rises from 21% in 2022 to 24% in 2023 and to 26% in 2024. About two-thirds of this forecast increase in renewables generation comes from new utility-scale solar photovoltaic capacity, and most of the rest is from new wind projects. The share of electricity generation supplied by natural gas is expected to decrease from 39% in 2022 to 38% in 2023 and 37% 2024 while the share of electricity generated by coal will fall from 20% in 2022 to 18% in 2023 and 17% in 2024. The share of nuclear power generation remains close to 19% over the next two years.
Power generators plan to add 32 gigawatts (“GW”) of utility-scale solar photovoltaic (PV) in 2023 and another estimated 32 GW in 2024. The small-scale solar capacity will grow by 9 GW in 2023 and by 12 GW in 2024. Wind capacity increases by 6 GW in both 2023 and 2024. Battery storage additions to capacity are 10 GW in 2023 and 9 GW in 2024.
Economy, Weather, and CO2
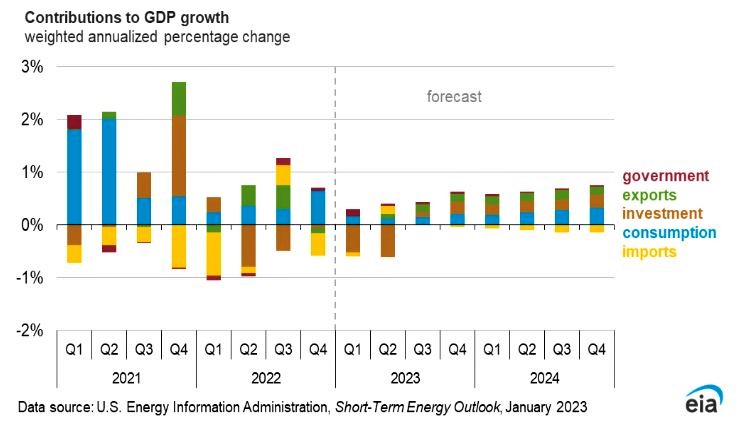
U.S. macroeconomics. EIA incorporates STEO energy price forecasts into their S&P Global macroeconomic model to obtain the final U.S. macroeconomic outlook for their forecast, S&P Global is forecasting a mild recession, starting in 1Q23. As a result, EIA forecasts GDP to grow by 0.5% in 2023, with the economy recovering from the recession and returning to positive GDP growth in 3Q23. In 1Q23, real GDP contracts at an annual rate of 0.7%, mostly due to a decline in residential fixed investment and private business inventories of goods. The recovery expectation is to be led by net exports and personal consumption expenditures in 2Q23, with the entire economy returning to growth later in the year.
Personal consumption expenditures are expected to grow through 2024, despite an increase in consumer savings from historically low levels. Throughout 2023, EIA expects the labor market to weaken, with the unemployment rate reaching a peak of 5.2% in 4Q23.
Emissions: The EIA predicts the total energy-related carbon dioxide (“CO2”) emissions to decrease in the United States by more than 3% in 2023. Relatively flat economic growth and an increase in electricity generation from renewable sources decreases fossil fuel consumption, and therefore emissions. Among the major fossil fuel categories, CO2 emissions from coal decline the most in the United States at around 11%, mostly from decreasing coal-fired electricity generation. More renewable generation contributes to decreases in natural gas-fired electricity generation, which in turn decreases CO2 emissions from natural gas by 2%. The petroleum emissions are expected to remain about the same.
U.S. energy-related CO2 emissions in 2024 remain unchanged from 2023 in the EIA forecast because increasing emissions from petroleum products offsets decreasing emissions from natural gas. Petroleum CO2 emissions increase slightly as a result of increases in air and road travel, as well as increasing hydrocarbon gas liquid consumption, particularly propane. More consumption of propane arises from increased industrial activity, as propane is used as a petrochemical feedstock.
Weather. In December, the United States experienced 27% more population-weighted heating degree days (“HDDs”) than last year and 9% more than the 10-year average. Based on forecasts from the National Oceanic and Atmospheric Administration, EIA expects 1Q23 to be milder than last winter, with 5% fewer HDDs in the United States compared with 1Q22 and 4% fewer than the 10-year average. EIA has updated their expectations for winter heating fuel expenditures based on the most recent temperature and price forecasts.
To read the detailed report, click here.